Artikler
Ultrasonic testing gauge with integrated technical drawings improves the accuracy and safety of flaw detection in welds and metal structures.
arrow_backTo the overview21 August 2025 | Strenometer ApS
Strenometer presents the Sonatest Wave
A brief introduction to ultrasonic testing
Ultrasonic gauges are widely used to measure the thickness of—and detect flaws in—metals and welds. These flaws can include laminations, bonding defects, holes, cracks, corrosion, and more.
By analyzing what’s known as an A-scan and interpreting the signal responses, a trained inspector can determine the location and size of a flaw and provide documentation on how critical it is. However, this assessment isn’t always straightforward, as signal responses can also come from dimensional features or areas irrelevant to the inspection.
Comparing measurements with technical drawings increases confidence in flaw identification and helps avoid costly repairs.
What is an A-scan?
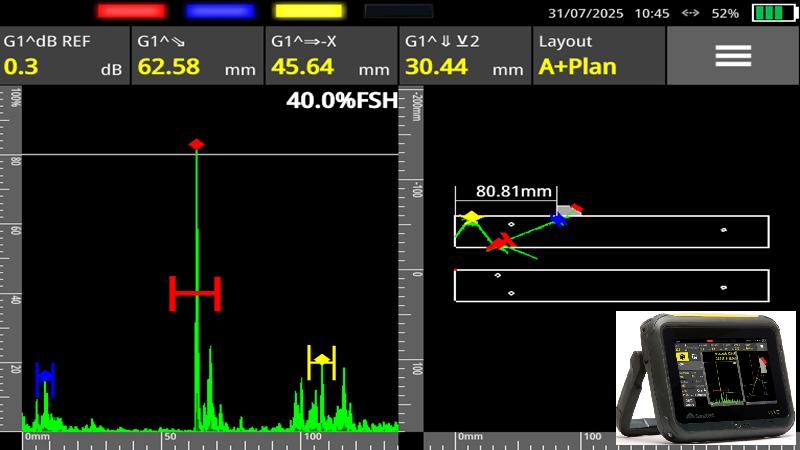
When measuring thickness or detecting flaws in metals, a sound signal is sent into the material from a transducer. When the signal encounters a material with a different density than the base material, an echo is returned and displayed as a signal on an A-scan, which shows the sound wave’s travel path (see the left side of the attached image).
Depending on the transducer type, the strongest echo usually comes from the back wall—i.e., when the sound has traveled all the way through the material. Other echoes may come from laminations, bonding defects, holes, cracks, corrosion, etc., indicating flaws in the material. Since these flaws can be critical to the component’s lifespan and structural integrity, inspections are typically performed both during production and as part of ongoing maintenance.
Imagine the task is like finding hidden holes in a large block of cheese. How would you approach it without cutting the cheese open?
In the image attached to this article, a scan of a square bar with three prefabricated through-holes is shown (these represent the “holes in the cheese”). In this case, we can see them because they go all the way through, but the scan is performed from one of the solid sides where the holes are not visible.
On the A-scan (left side of the image), the x-axis shows the sound wave’s travel distance, and the y-axis shows the echo strength. Three echoes are marked by the blue, red, and yellow gates. The strongest echo appears at the red gate.
The question is: what do these echoes actually represent? Trained inspectors, thanks to their experience, education, and expertise, are good at interpreting them—but what if there’s still doubt or a need to document findings for someone with less technical background?
This is where the Sonatest Wave offers a unique advantage: it allows you to import technical drawings of components and display flaw locations directly on them.
On the right side of the attached image (ignore the measuring device itself), a simple technical drawing of the square bar is shown (there are two drawings—the lower one shows the bar rotated 180°, allowing measurements and results to be shown from both sides).
We can see that the yellow and blue signals are surface and entry “noise,” while the dominant signal at the red gate indicates a hole or crack in the bar material. The 30.44 mm indicates the depth at which the flaw is found. The bar is 35 mm thick, so the flaw is located about 5 mm from the bottom.
The Sonatest Wave is Wi-Fi compatible, so once flaws are detected, comprehensive PDF reports with image documentation can be quickly and efficiently generated and shared directly from the device.
If you want to learn more about the capabilities of the Sonatest Wave, visit Strenometer ApS at the Herning Industrial Fair, September 30 to October 2, 2025, Stand K 8070.


